Surface roughness can be quite complex, and there are not many people who fully understand it. However, analyzing surface roughness is very important for making good products without defects. You don’t need to understand everything – focus on understanding the parts you will use.
Formally called surface texture, surface roughness is divided into “roughness” and “waviness.” It is important to grasp which wavelength of the surface texture affects the performance of parts and to distinguish between roughness and waviness.
Parameters like Ra and Rz that are often used in drawings are called parameters. The evaluable features differ for each parameter, so it is where the measurer’s skill lies to discern what characteristics you want to evaluate and which parameter is most suitable for it.
In this article, we will explain the basics of surface texture parameters. By understanding how surface texture parameters are calculated, it can be applied to good product development.
Difference Between Cross-Section Curve, Waviness Curve and Roughness Curve
When calculating surface texture parameters, calculations are made based on the following three curves:
- Cross-section Curve
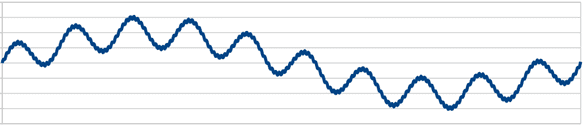
This is the measured shape obtained by measuring the surface with a measurement instrument. It contains various wavelength components mixed together.
By removing noises and short wavelengths from the measurement cross-section curve, we get the “cross-section curve”. How much short wavelength to remove is determined by the cutoff value λs.
For example, if λs = 2.5 μm, the shape of wavelengths of 2.5 μm or less will be ignored.
- Waviness Curve
The waviness curve, as shown in the figure above, is obtained by removing short wavelength shapes from the measurement cross-section curve. How much short wavelength to remove is determined by the cutoff value λc.
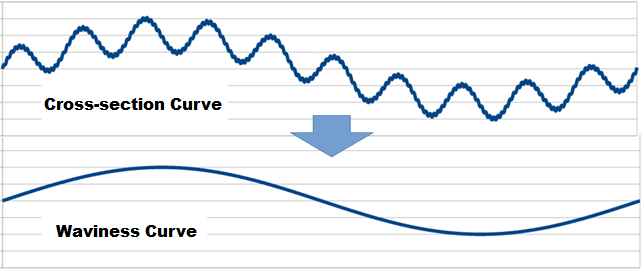
For example, if λc = 0.8 mm, shapes of wavelengths shorter than 0.8 mm will be ignored.
Additionally, shapes of overly long wavelengths may also be removed from the waviness curve. The cutoff value for overly long wavelengths in that case is λf. In other words, the waviness curve focuses on the wavelength range between λc and λf.
- Roughness Curve
The roughness curve, as shown in the figure above, is obtained by removing long wavelength shapes (waviness curve) from the cross-section curve. While waviness ignores wavelengths shorter than λc, roughness ignores those longer than λc.
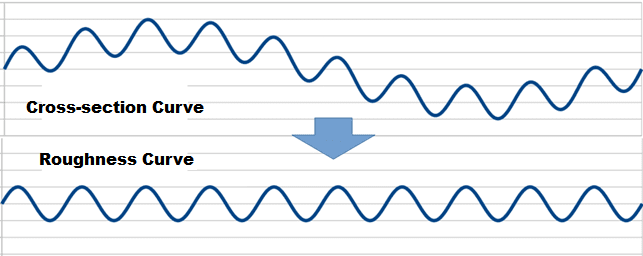
For example, if λc = 0.8 mm, shapes of wavelengths longer than 0.8 mm will be ignored.
Since the cross-section curve ignores shapes below λs, the roughness curve ignores shapes below λs and above λc. In other words, it focuses on the wavelength range between λs and λc.
Wavelength Components of Each Curve
The wavelength components contained in each curve are divided based on λs, λc, and λf as shown in the figure above. The values of λs, λc, and λf change depending on the functionality you want to impart on the surface.
Determining λc
| Ra μm | Rz μm | λc mm |
| (0.006) <Ra≦ 0.02 | (0.025) <Rz≦ 0.01 | 0.08 |
| 0.02 <Ra≦ 0.1 | 0.1 <Rz≦ 0.5 | 0.25 |
| 0.1 <Ra≦ 2 | 0.5 <Rz≦ 10 | 0.8 |
| 2 <Ra≦ 10 | 10 <Rz≦ 50 | 0.25 |
| 10 <Ra≦ 80 | 50 <Rz≦ 200 | 8 |
Determining λs
Once λc is determined, λs is also inevitably determined. The relationship between λc and λs is as shown below:
| λc mm | λs μm |
| ~0.8 | 2.5 |
| 2.5 | 8 |
| 8 | 25 |
Surface Roughness Parameters
Merely looking at the cross-section, roughness, and waviness curves is not enough to evaluate the surface. Parameters such as Ra and Rz obtained from the height data of each curve allow quantitative evaluation. Each parameter has its own unique calculation formula, and the evaluable features differ depending on the parameter.
There are many surface texture parameters that are defined. When wanting to impart special functions to the surface, it is necessary to select the appropriate parameter from many parameters. The parameter is selected differently depending on whether you want to evaluate wear resistance, lubricity, tight adhesion, water repellency, or the presence of flaws. However, there are a few parameters that are commonly used for machined surfaces, so let’s start with understanding the two most commonly used ones: Ra and Rz.
Average Roughness Ra Calculation
The most commonly used surface roughness parameter is the arithmetic average roughness Ra. The calculation formula is as follows:
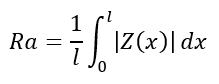
Where Z(x) represents the height at position x. This formula is shown in the diagram below:
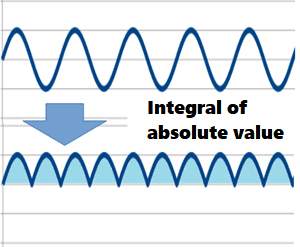
The area in light blue color gives the value of Ra. Ra is the average value, so it is not affected by flaws or protrusions and provides a stable result. Simply, the larger the numerical value, the rougher the surface. Ra is a parameter calculated from the roughness curve. Those obtained from the cross-section curve and waviness curve are expressed as Pa and Wa, respectively. In three-dimensional analysis, it is expressed as Sa.
Maximum Height Roughness Rz Calculation
Another parameter often used together with Ra is the maximum height roughness Rz. The highest point within the reference length is called the maximum peak height Zp, and the lowest point is called the maximum valley depth Zv. The difference between these is the maximum height roughness Rz(=Zp-Zv).
This is illustrated in the diagram below:
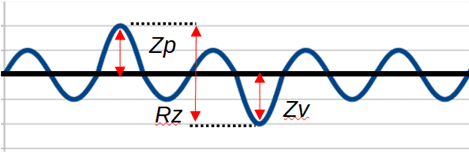
Ra cannot detect the presence of flaws or protrusions, so Rz is useful for quality stability. Rz is also a parameter calculated from the roughness curve. Those obtained from the cross-section curve and waviness curve are expressed as Pz and Wz, respectively. In three-dimensional analysis, it is expressed as Sz.
Surface texture refers to fine irregularities on the surface. There are “cross-section curves”, “roughness curves” and “waviness curves” that must be distinguished based on the target wavelengths. The most commonly used is the roughness curve. Parameters obtained from the roughness curve, such as Ra and Rz, are often used.
The evaluation can be changed by selecting different parameters. When determining which parameter to use for evaluation, extensive experience is required, so initially refer to manufacturer opinions.