The tools most often used for problem solving by organizations well versed in quality control are called the Seven QC Tools. In this guide, we give a general usage definition of the seven basic QC tools and detail how the 7QC tools can help your organization improve no matter what type of work you do.
Officially, the seven basic quality tools are a group of highly efficient proven tools developed by many different gurus. They are divided into:
1. Process Map
The first QC tool is used to help employees and organizations understand the finite details and obtain a thorough description of the process that’s being applied to. The other very important aspect of a process map is to visually identify the process or system that it’s being used on officially. The process map can take or be defined as a diagram of the flow of production process or service process through a system. Standard symbols are often used to designate processing flow directions, branching decisions and inputs and outputs. There are various ways to formulate a process map, some include gathering a team of subject matter experts and analysts to use post-it notes individually listing the process steps and laying them out in sequence on a wall. Another way would be to use digital applications.
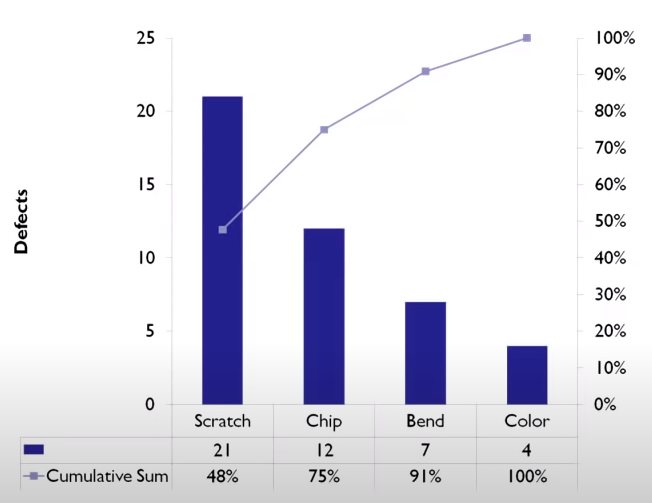
2. Pareto Chart
Pareto Charts classifies problems and defects by type in the order of quantities and shows the cumulative total. Now Pareto Charts are often used for checking a problem or defect to be highlighted for solution. In other words, Pareto Chars often help us identify where the problem is.
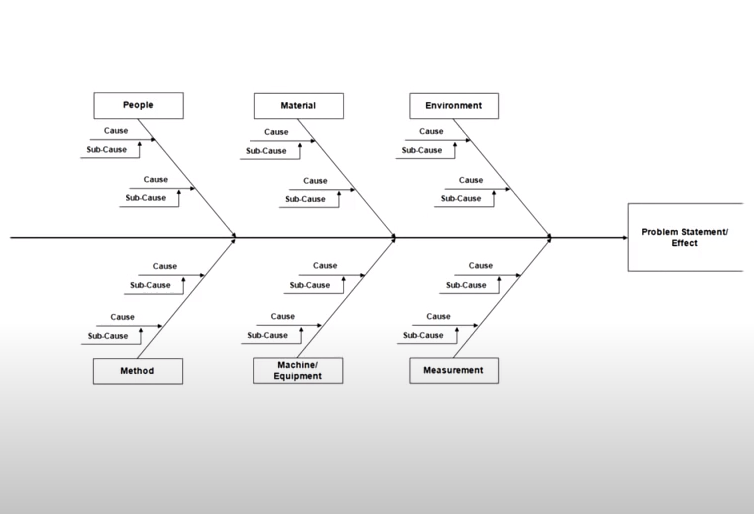
3. Cause And Effect
The cause and effect diagram is one of the most common and well-known quality tools. It’s a method of linking and organizing factors that affect an issue or problem being investigated. The ultimate goal of the cause and effect diagram is to identify all of the possible causes of an effect and investigate further with the intention of discovering root causes. All in all, the cause and effect diagram systematically arranges the results of effects and the factors that influence them. With this information, we’re able to classify causes and their potential influence on the problem at hand.
4. Check Sheet
Check sheets are tables used to arrange data by type. They are simple and easy tools for summarizing occurrences of specific events through tally counting, checking if jobs are completed without problems and for preventing mistakes from happening at all. One important thing to keep in mind when creating a check sheet is that the team members who are creating the check sheets have ample amounts of time to create and gather accurate data.
5. Histogram
The next tool in our set of seven basic quality tools is the histogram. It’s a graphical display of numerical data in the form of upright bars such as temperature wait and oftentimes dimension in a process. With histograms, we’re able to learn many things including how much variation or spread, a data set contains.
6. Control Chart
Control chart is a tool used for judging the situation of quality values against control limits in order to check the stability of a process. It also help us to under stand whether we’re dealing with common cause or special cause variation.
7. Scatter Diagram
This QC tool is used to show the relationship between two variables by plotting corresponding date. In other words, scatter diagrams help us examine the relationships between two variables and whether or not they’re associated, or correlated, with on another.